Where is My Python Code Spending Time?

So we spoke about async in the last blog. And we talked about when to prefer async vs multiprocessing. All of that boils down to understanding where our Python code is spending time.
Of course, there is a way by sprinkling print("here1"), print("here2"), and time.time() statements all through the code. But eventually it makes the code messy and difficult to clean up later. And for the most part of it, in programming, if you feel a certain process is messy, there probably is a better way to do it.
In this blog, we will cover exactly that. Let me introduce you to cProfile—we would understand the usage of cProfile which is a very common built-in library in Python to monitor the time taken by each function in the code. We would see what it is, how to use it, how to interpret it, and will end by visualizing the output of the profiler.
Shall we start? Wait, just one more heads-up—
To be able to use the profiler's output in a meaningful way, it's of utmost importance that the code you have written should be modular, functionized properly. Because at the end, what the profiler measures is how much time different functions in your code took, so if there would be just one big block of code doing all the task, interpreting the results would be a nightmare for you🙂
Let's start now—
What is cProfile?
Think of cProfile as a stopwatch that tracks every single move the program makes. It is a "deterministic profiler", which is a fancy way of saying it captures every function call, every return, and every exception. It doesn't estimate; it measures (there are statistical profilers as well, but that's a tale for some other day)
Fun fact: The C in cProfile comes from the C extension of the profiler, which makes it very fast with little overhead. There is another module—profile—for the same task but it adds significant overhead to the profiled programs. For the geeks who want to know further can refer to this—Python documentation
How to use cProfile?
cProfile is a built-in module nowadays in Python, so we don't need to install anything separately. We can jump directly in—let's see usage with the help of some code. Let's say you have a main.py file with the following code—
import time

def sub_task1():
    # Simulating a small calculation
    sum(i * i for i in range(1_000_000))

def sub_task2():
    # Simulating a small calculation
    sum(i * i for i in range(10_000_000))

def main_bottleneck():
    sub_task1()
    sub_task2()
    time.sleep(1)  # Simulating some other operation in this function

if __name__ == "__main__":
    main_bottleneck()
Very simply, there are two functions, sub_task 1 & 2—simulating let's say a calculation/API call. Then there is main_bottleneck, which calls these functions, and there is a time.sleep to simulate some other operation happening in this function.
You can run the profiler on this code, using a variety of ways—I will cover three common ones—using command line and calling the profiler directly in the code.
-
Using command line—No code change is required in main.py, just run this command in the terminal—
python -m cProfile main.py. This will run the Python program and profile the code as well -
Calling directly in code—update the main.py like this—
if __name__ == "__main__": import cProfile cProfile.run('main_bottleneck()') -
Another way to call in the code—
if __name__ == "__main__":
    import cProfile
    import pstats                    # We will come to pstats later
    profiler = cProfile.Profile()

    profiler.enable()
    main_bottleneck()
    profiler.disable()

    stats = pstats.Stats(profiler)
    stats.print_stats(20)           # top 20 lines
Note: All of these methods will profile the entire code of main.py. The third one can also be used to profile specific parts of the code. For the geeks—read more about that way to run cProfile here—cProfile Implementation
Coming back to using cProfile, it's that easy to profile your code, with just a couple of lines changed, and you are done. Let's look at the results?
How to interpret the cProfile output?
Running the profiler would give you a sort of table shown below—
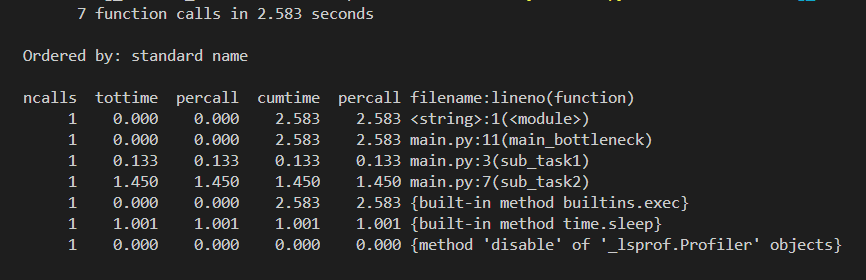
Easy to get intimidated here with the output table, however it's pretty straightforward and intuitive. Let me ease it in for you—
- At the top, we see the total number of calls made in the profiled program and the total execution time. (Which is 7 & 2.583 seconds in our case)
- ncalls: Number of calls made. When there are two numbers in the first column (for example 3/1), it means that the function recursed. The second value is the number of primitive calls and the former is the total number of calls. Note that when the function does not recurse, these two values are the same, and only the single figure is printed.
- tottime: Total time spent in the function, not including calls to other functions.
- percall: Average time per call for tottime, derived by taking tottime/ ncalls.
- cumtime: Total time spent in the function, including calls to other functions. (Slightly different from tottime)
- percall (#2): Average time per call for cumtime (cumtime /ncalls).
- filename:lineno: The file name, line number, and function name for the call in question. You would see functions you defined plus all the system functions which were called in the process here as well
So, depending upon your use case, you might want to look at tottime or cumtime. But be mindful that cumtime includes time spent in child functions, so values can overlap.
Looking at the example output, sub_task2 clearly takes the most time (~1.45s), while sub_task1 is much faster (~0.13s). The main_bottleneck function itself does very little work, so its tottime is near zero, but its cumtime reflects the time spent in the functions it calls.
Interpreting cProfile's output is as simple as that. But what if you want to store this output somewhere in a file, or sort it based on a given column, or do some analysis?
Enter pstats, a very common module that goes hand in hand with cProfile.
How to export the cProfile's output?
Exporting the profiler's output is straightforward. Let's say you have updated the code and sprinkled profiler.enable() and profiler.disable(). Adding just 2 more lines of code will export the profiler's results into a .prof file—
import pstats
stats = pstats.Stats(profiler)
stats.dump_stats('results.prof')
You can also sort or filter the results before exporting—
stats.sort_stats('tottime')
stats.print_stats(10) # Only print the top 10 offenders
If you want to know more options, please refer to—Python documentation - Stats
But wait, for small code it's fine, but for large nested code, this can very soon become daunting to look at the profiler's output. As you would have guessed it, there is a better way. We can actually visualize the profiler's output—let's switch gears?
How to Visualize profiler's Output Using Snakeviz?
Humans are visual creatures, so it only makes sense to be able to visualize the profiler's output. There are a bunch of ways to visualize it. I will cover the one which I use the most—Snakeviz—but you can plug the output into any module and visualize it.
Snakeviz basically runs in the browser and creates sunburst/icicle charts where we can visually see and zoom in to the functions. Let's look at the implementation
- Let's say you have saved the output in results.prof
- Install snakeviz via terminal—
pip install snakeviz - To run the visualizer, simply run in terminal—
snakeviz results.prof
A window would open in your browser where you can visually see the hierarchy plus function call time taken—everything—you can slice and dice into a specific function and can see more info about the calls below.
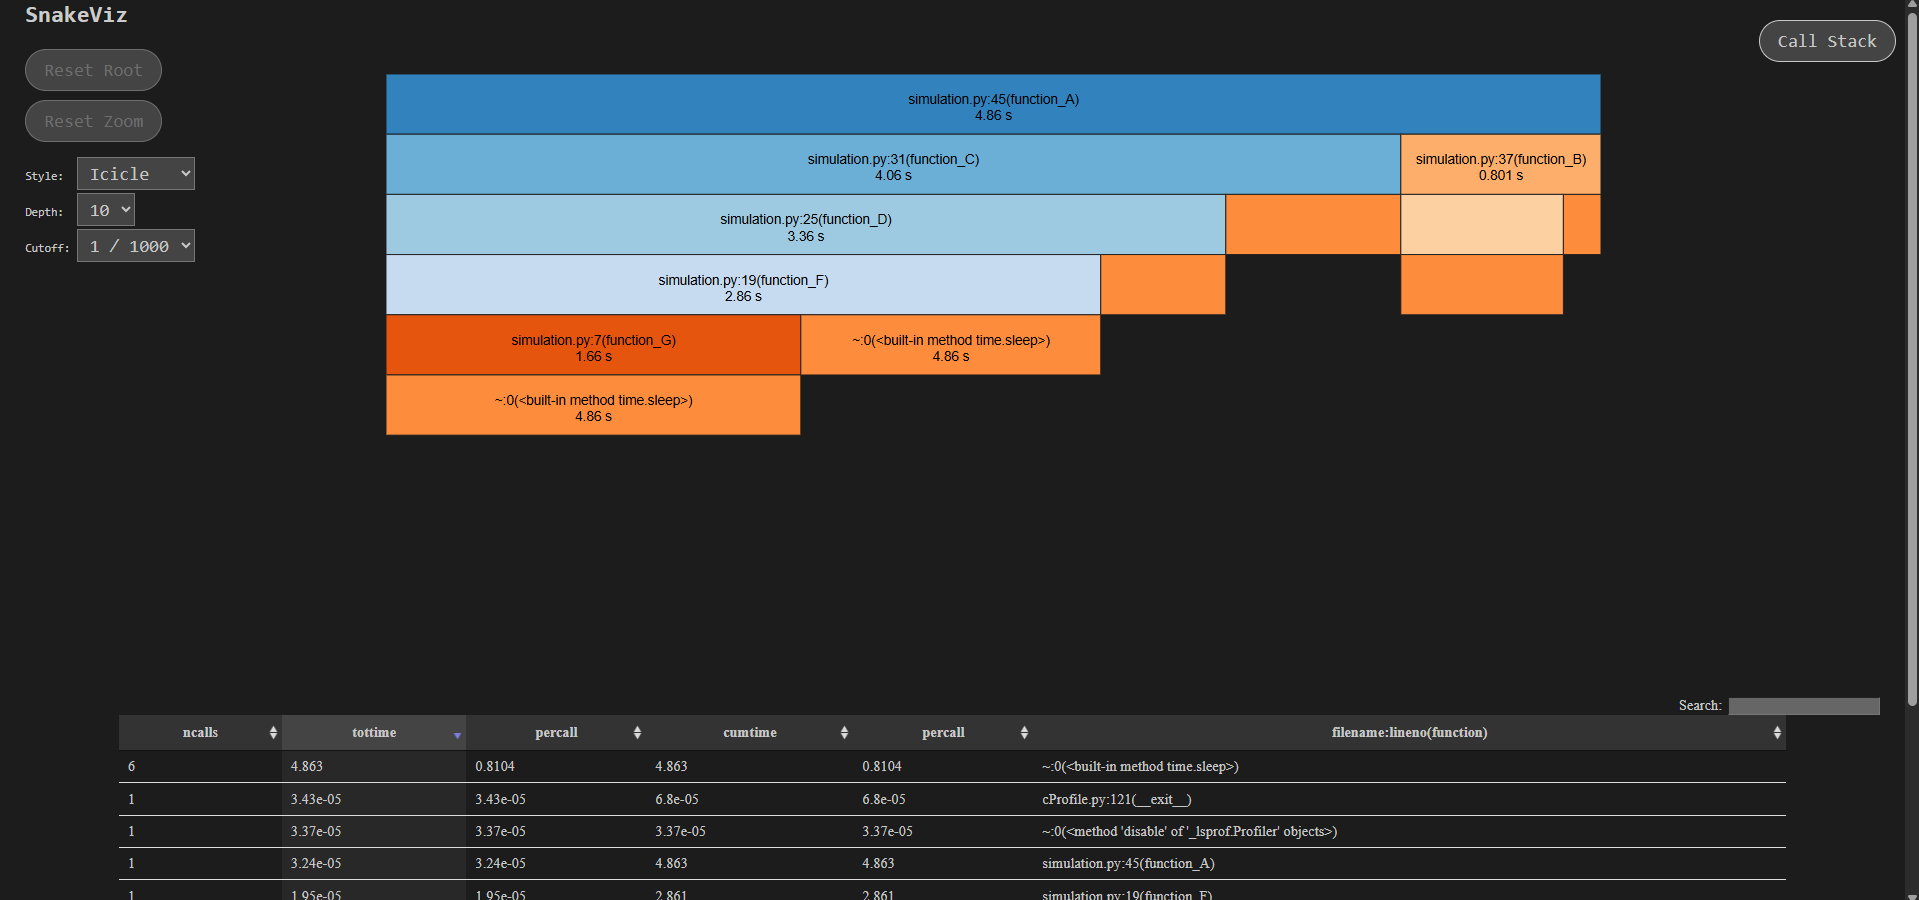
Note: The screenshot above is from a different example to demonstrate nested calls. For our earlier example, the visualization would be fairly simple.
Much better than having to look at the raw tables, right?
Closing Thoughts
There are many tools available for profiling Python code, but cProfile remains one of the most convenient thanks to its tight integration with Python itself.
One final reminder: always profile before optimizing. Otherwise, it’s very easy to spend time optimizing parts of the code that don’t actually matter — or don’t move the needle in any meaningful way.
You get the idea 🙂
Happy exploring. Bye!
Thoughts? Questions?
If something here sparked a thought, or if you have feedback or questions, I'd love to hear from you.